 English
 Indonesia
In modern industrial injection molding—particularly within demanding North American automotive, aerospace, and medical device supply chains—the drive toward structural lightweighting and component integration has triggered an unprecedented reliance on thin-walled profiles and complex, fiber-reinforced polymer matrices. While these advancements yield substantial material and mass efficiencies, they significantly compound the risk of localized mechanical failure and cosmetic rejection stemming from knit lines and weld lines. Far from being simple surface blemishes, these structural interfaces represent deep discontinuities within the molded matrix where polymer chains fail to adequately interdiffuse. To protect tight OEM margins and maintain rigorous mechanical safety standards, manufacturers can no longer treat knit line remediation as a series of trial-and-error adjustments at the press. Instead, engineering teams must adopt a data-driven methodology that seamlessly links quantitative shop-floor inspection with advanced predictive simulation and optimized tooling layouts.
Detecting and Inspecting Knit Lines: Transitioning from Visual to Quantitative Metrics
To establish a robust quality control framework, molding operations must eliminate subjective visual evaluations and replace them with precise, quantifiable metrics. On the production floor, traditional visual inspection often categorizes knit line issues via vague qualitative descriptors. True process control requires converting these qualitative observations into digital, repeatable variables. Surface morphology must be categorized into distinct physical tiers: superficial micro-grooves, deep tactile notches, and differential localized discoloration. Using specialized imaging techniques, such as low-angle grazing lighting and high-contrast projection imaging, quality engineers can map surface deviations. For cosmetic components, spectrophotometers must be used to record chromatic shifts across the interface using the standardized CIELAB color space, establishing an upper threshold limit, such as Delta E_ab less than or equal to 0.5. Simultaneously, contact gloss meters are required to quantify local specular gloss reductions, ensuring the weld region matches the nominal texture within a specified tolerance value.
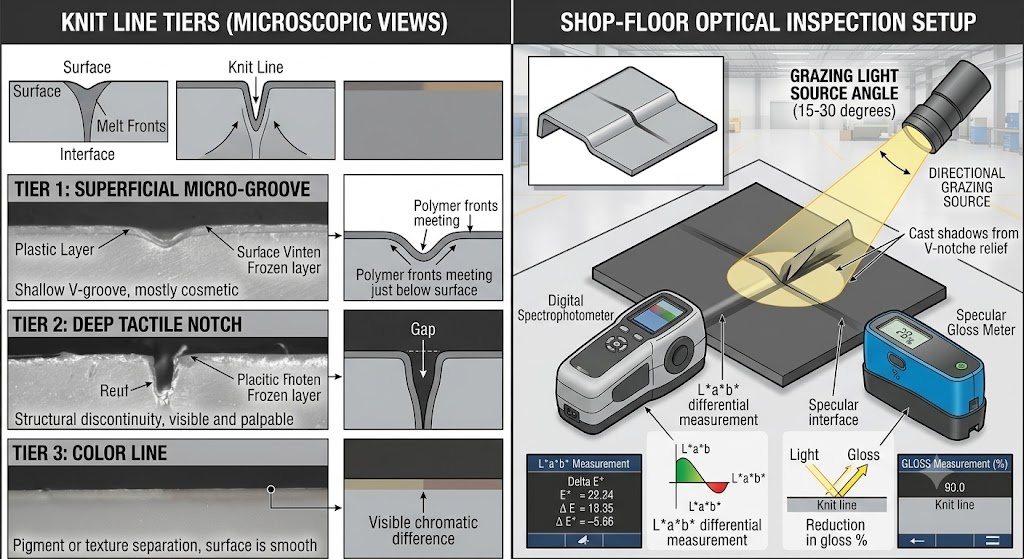
For load-bearing or fluid-critical engineering components, non-destructive surface measurements represent only half of the validation protocol. Mechanical integrity must be confirmed via rigorous standardized destructive testing regimens. Engineering protocols must mandate that tensile test bars (conforming to ASTM D638 or ISO 527) be harvested directly from production components, with the knit line precisely localized at the center of the gauge length. The mechanical performance of these specimens is then benchmarked against identical baseline specimens molded without an interface to calculate the Weld Line Strength Retention Factor (WRF), which is expressed by the following plain text equation:
While an aesthetic consumer housing may tolerate a significant drop in strength provided the color variance is negligible, critical automotive under-hood components or medical fluid manifolds frequently enforce strict quality thresholds, rejecting any batch that falls below a 90 percent or 95 percent retention value. If a weld line drops below these predetermined thresholds, quality engineers must execute an immediate 4-step shop-floor inspection checklist:
- Verify actual melt and mold cavity temperatures using calibrated thermal probes.
- Document the tactile depth profile using a surface profilometer.
- Cross-reference localized part weight against nominal limits to check for under-packing.
- If failure persists, extract samples for cross-sectional metallographic sectioning or scanning electron microscopy (SEM) to inspect for trapped microscopic volatiles or localized fiber misalignment along the fracture surface.
Root Causes and Predictive Simulation: Connecting Physics to Actionable Insights
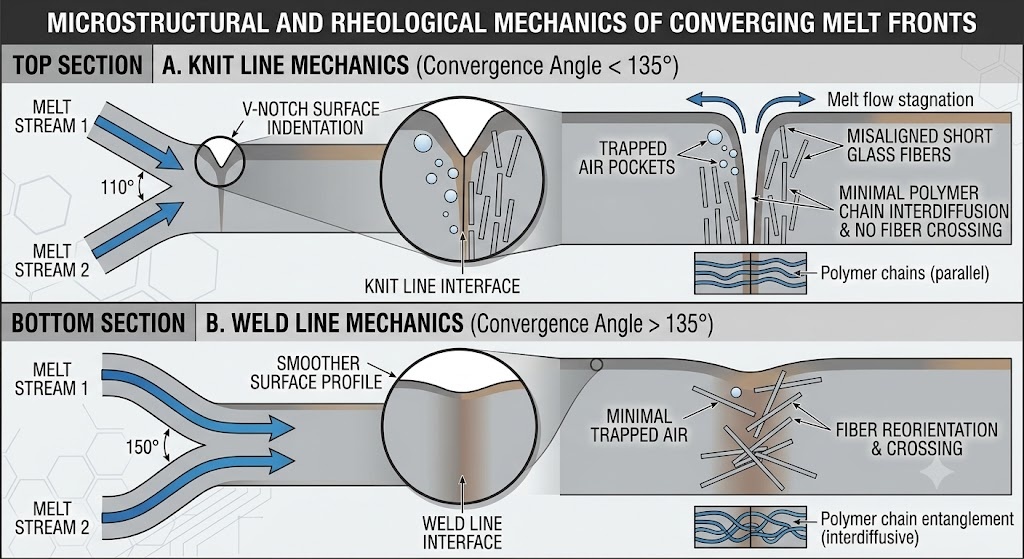
A knit line is formed when two or more distinct polymer melt fronts meet head-on within the mold cavity at an convergence angle of less than 135 degrees. When the converging angle exceeds this threshold, the boundary is technically classified as a weld line, allowing the parallel flowing streams to blend more naturally. The underlying physics governing the strength and visibility of this interface depend entirely on the thermodynamic state of the material during convergence. As the melt moves through the cavity, contact with the cooler mold steel creates a frozen boundary layer, which continuously narrows the active flow channel. If the local melt temperature drops near the material's transition point, or if the localized injection pressure decays due to long flow paths, the molecular chains lack the necessary thermal energy and packing force to cross the interface and interdiffuse. Furthermore, the split flow paths inherently force anisotropic reinforcements, such as short glass fibers, to rotate parallel to the meeting boundary, completely eliminating any mechanical bridging across the junction.
Rather than addressing these physical phenomena through expensive trial-and-error modifications after tool steel has been cut, advanced finite-element CAE tools (such as Autodesk Moldflow, Moldex3D, or Sigmasoft 3D) should be utilized during the product design phase. Engineers must look beyond simple, binary visual plots and evaluate quantitative analytical criteria. Key simulation outputs include tracking velocity vector stagnation points, identifying localized temperature drops at the junction, and extracting the numerical Weld Line Intensity Index (VHI). A highly reliable method for evaluating structural integrity involves mapping the projected fiber orientation tensors directly from the injection simulation into downstream structural FEA packages, allowing designers to simulate localized stress concentrations under real-world mechanical loads. To ensure accurate prediction, simulation models must use highly refined 3D meshes consisting of at least 10 to 12 layers across thin wall sections, combined with verified material characterization data and accurate machine response parameters.
To turn these virtual CAE diagnostics into practical shop-floor solutions, engineering teams should follow a standardized diagnostic decision tree. When a simulation indicates an unacceptable knit line risk, the engineer must systematically evaluate and isolate variables rather than adjusting parameters at random. First, check if the junction can be moved to a non-critical region by shifting gate locations. If geometric constraints make gate relocation impossible, the next step is to evaluate localized thermal management, assessing whether variable mold temperature adjustments can improve molecular bonding. Finally, if thermal adjustments are insufficient, the mechanical wall thickness must be altered to lower local flow resistance and increase packing pressure. This structured method ensures that modifications to tooling and processes are based on sound engineering principles, significantly reducing development cycles and preventing costly engineering change orders (ECOs) late in the launch cycle.
Mold Design and Gate Location Strategies: Controlling Flow Paths and Thermal Layouts
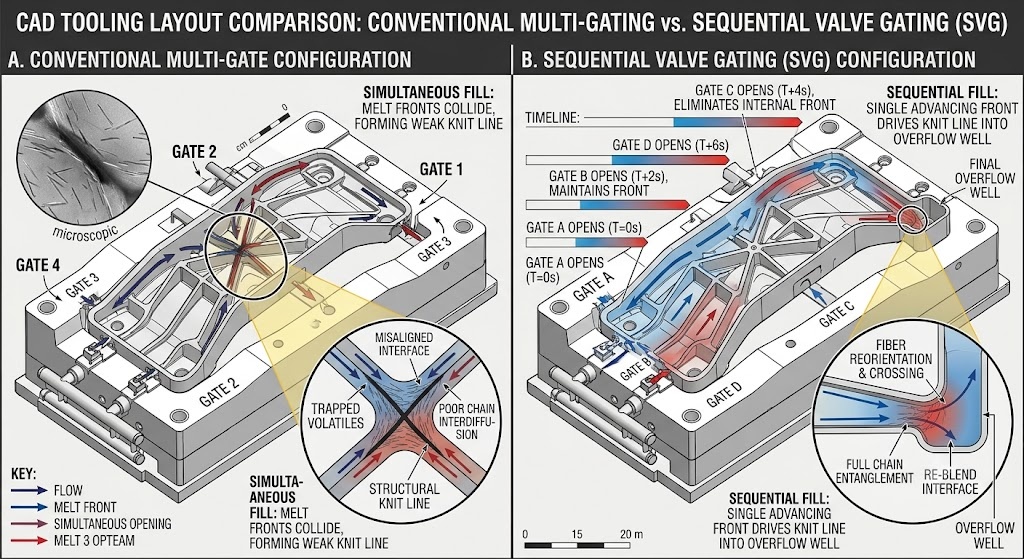
The primary method for eliminating or relocating knit lines is the strategic placement of the tool's gating system. The selection of gate geometry—whether utilizing precise direct valve gates, edge gates, or fan gates—dictates the initial fill pattern and directly controls how flow fronts split and recombine around core pins or internal cutouts. When designing complex parts, engineers must establish precise rules regarding flow distance and maximum permissible flow-length-to-wall-thickness ratios. For instance, in thin-walled consumer electronics, a sequential valve gating (SVG) strategy is often employed. By using electronically controlled hydraulic or pneumatic pins to open valve gates in a precise, timed sequence, engineers can completely eliminate the formation of internal knit lines by forcing a single, continuous melt front to sweep across the cavity, shifting weld lines into peripheral flash areas or non-structural edges.
Beyond gate placement, managing thermal performance within the mold steel is critical for optimizing knit line quality. Traditional straight-drilled cooling lines often leave deep core sections and complex corners isolated from effective thermal cooling, resulting in localized hot spots or severe thermal gradients that weaken the knit line interface. Replacing conventional lines with advanced conformal cooling channels—manufactured via direct metal laser sintering (DMLS)—allows cooling lines to follow the exact contours of the part cavity. This ensures highly uniform heat dissipation and enables precise localized rapid heat cycle molding (RHCM). By using steam or high-temperature pressurized water to rapidly heat the local knit line area during filling, and then switching to cold water for rapid solidification, manufacturers can maintain the cavity surface temperature above the resin's glass transition or crystalline melting point during knit line formation. This completely eliminates surface notches and maximizes polymer chain entanglement.
| Tooling Strategy | Typical Tooling Cost Premium | Cycle Time Impact | Knit Line Strength Improvement | Best Application Fit |
| Conventional Machined Cooling | Baseline (0 dollars) | Baseline (25 to 45 seconds) | Minimal (0 to 10 percent improvement) | Low-complexity, thick-walled structural blocks. |
| Conformal Cooling Insert (DMLS) | +15 percent to +30 percent | 15 percent to 30 percent reduction | 15 percent to 30 percent increase | Complex automotive trim, multi-cavity medical parts. |
| Sequential Valve Gating (SVG) | +25 percent to +40 percent | Neutral | Relocates defect entirely | Large body panels, instrumental panels, long covers. |
| Rapid Heat Cycle Molding (RHCM) | +40 percent to +60 percent | 10 percent to 25 percent increase | 40 percent to 70 percent increase | High-gloss consumer displays, medical optical housings. |
Before implementing these advanced tooling modifications, engineering teams must conduct a rigorous upfront return on investment (ROI) and risk assessment. While adding a DMLS conformal insert or an SVG manifold can increase initial tooling capital expenditure by tens of thousands of dollars, these costs must be carefully balanced against long-term operational metrics. For a high-volume automotive production run spanning several years, a 20 percent reduction in cycle time combined with a significant reduction in scrap rates easily justifies the upfront tooling premium. Conversely, for lower-volume medical components, modifying part wall thicknesses or incorporating localized overflow wells—which collect the cold slugs at the end of the flow front and can be cleanly machined off post-molding—presents a more cost-effective alternative that achieves required mechanical specifications without exceeding the project's capital budget.
Processing, Materials, and Production Trade-offs: Optimizing Parameter Matrices
When tooling modifications are constrained by budget or timelines, engineers must rely on systematic process optimization and careful material selection to manage knit line performance. The molecular structure of the raw polymer dictates its rheological behavior during melt front convergence. Unfilled commodity resins like polypropylene (PP) or amorphous acrylonitrile butadiene styrene (ABS) flow easily and bond readily at lower relative energies. However, high-temperature engineering plastics like polycarbonate (PC), polyamide 6/66 (PA6/PA66), and polyphenylene oxide (PPO)—especially when filled with 30 percent to 50 percent glass fibers or mineral modifiers—present severe rheological challenges. For these advanced compounds, parameter adjustments must follow a highly structured, "conservative-to-aggressive" processing matrix to avoid material degradation or cycle time extension.
To systematically resolve knit line defects on the production floor, technicians should consult a comprehensive material and processing parameter guideline. Adjustments should always be executed sequentially, allowing the process to stabilize for several cycles after each modification to accurately measure the impact on part quality and structural performance:
| Resin Matrix Type | Recommended Melt Range (deg C) | Recommended Mold Range (deg C) | Primary Injection Speed Tuning Step | Expected Knit Line Strength Retention (%) |
| Unfilled Polypropylene (PP) | 200 - 240 | 30 - 60 | Moderate Progressive (+10% increments) | 85% - 95% |
| ABS (Aesthetic Grade) | 220 - 260 | 50 - 80 | High Velocity Profile (Fast through knit zone) | 80% - 90% |
| Polycarbonate (PC) | 280 - 320 | 80 - 110 | High Constant Velocity with High Pack | 70% - 85% |
| PA66-GF30 (30% Glass Filled) | 270 - 300 | 80 - 120 | Ultra-High Velocity (Max shear heating) | 35% - 55% |
| PPO (Modified / Structural) | 260 - 310 | 70 - 100 | High Velocity followed by Immediate Pack Shift | 50% - 70% |
If optimized processing parameters cannot fully eliminate a visible knit line on a highly aesthetic component, secondary finishing operations may be required. Post-mold remediation options—including mechanical sanding, automated priming and painting, chemical vapor polishing, or localized ultrasonic fusion—can effectively mask surface blemishes, but they introduce significant production trade-offs. While a secondary polyurethane coating or chemical solvent wash can restore a flawless, high-gloss surface finish to an amorphous consumer housing, these operations increase total piece part costs, require additional labor, and raise scrap rates due to handling defects. Furthermore, surface finishes do not fix underlying structural flaws. If glass fibers remain misaligned beneath a painted surface, the part will fail under mechanical stress. Operations managers must carefully weigh these finishing costs against the long-term capital investment of advanced tooling upgrades, choosing the option that best balances quality, cost, and component reliability.
Accelerate Your Tooling and Processing Performance
Eliminating knit line failures requires aligning upfront predictive engineering with disciplined quality control. Download our comprehensive, shop-floor ready Knit Line Troubleshooting and Simulation Calibration Checklist (PDF), containing step-by-step molding machine adjustment templates, target VHI meshing parameters, and ASTM/ISO validation forms.
Need immediate engineering support for an active program? Contact our technical team today to schedule an advanced CAE Simulation Review and Mold Layout Audit. Our North American manufacturing specialists provide detailed diagnostic turnarounds within 3 to 5 business days.

